|
AUD/NZD
|
|
·
The greenback traded
unchanged or lower against the other G10 currencies during the European morning
Thursday. It depreciated against AUD, NZD, JPY and CHF, while it was virtually
unchanged against EUR, GBP, SEK, CAD and NOK.
·
The Australian dollar
continued its rally, taking the first place among today’s winners, driven by a
9.8% rise in firms’ estimates for capital spending for 2014/15, overshadowing a
dip in actual capital expenditure in Q1. AUD/USD moved higher as it remained
supported by the 0.9200 area, but the most noticeable move, from a technical
point of view, came from AUD/NZD which surged above 1.0900, the upper boundary
of the sideways path it’s been trading since the 13th of December 2013.
·
Gold continued
declining and found support one dollar above our hurdle of 1250. Although we
may experience a bounce near that zone (considering positive divergence between
our momentum studies and the price action on the 1-hour chart), I still see a
negative picture. A dip below the 1250 zone could open the way for the 1235
barrier.
·
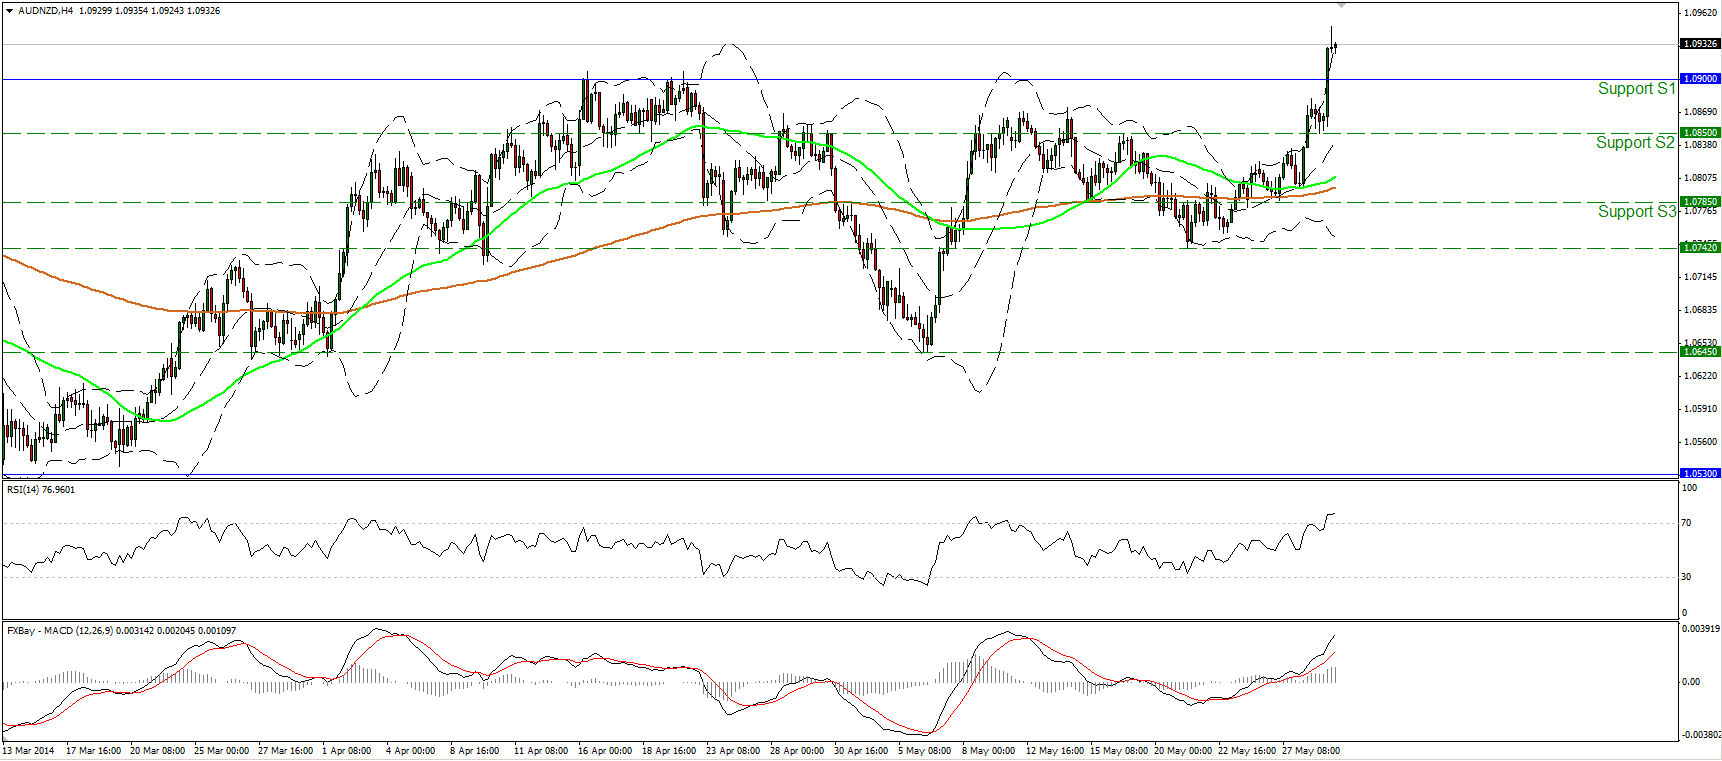
AUD/NZD
surged during the
European morning, breaking above the key hurdle of 1.0900 and completing a
short-term inverted head and shoulders continuation pattern*. On the daily
chart the 1.0900 barrier is the upper boundary of the long-term sideways path
the pair was trading since the 13th of December 2013. As a result I would
expect the break to see as a first target the 1.1050 (R1) barrier, which
coincides with the 161.8% extension level of the formation’s width. A
successful move above that level could extend the advance towards the
longer-term target of 1.1210 (R2), slightly below the 200% extension level of
the width of the long-term sideways path between the 1.0530 and 1.0900 levels.
Nonetheless, zooming in on the 1-hour chart, the RSI seems ready to exit
overbought conditions, while the MACD shows signs of topping. As a result we
may experience a pullback to test the 1.0900 obstacle as a support this time
before the bulls take control again.
·
Support: 1.0900 (S1),
1.0850 (S2), 1.0785 (S3)
·
Resistance: 1.1050
(R1), 1.1210 (R2), 1.1310 (R3)
* Since
an inverted head and shoulders formation has bullish implications, if it occurs
after an uptrend it is considered a continuation pattern. Usually we identify
the formation at market bottoms, signaling a trend reversal.
No comments:
Post a Comment